eCommerce help for customers
Analyze and report on your purchase history
You can analyze and report on your web-based purchase history using the Customer Purchase Analysis (CPA) set of reports.
Note: Customer Purchase Analysis is an additional module.
- From the My Account menu, select Customer Purchase Analysis.
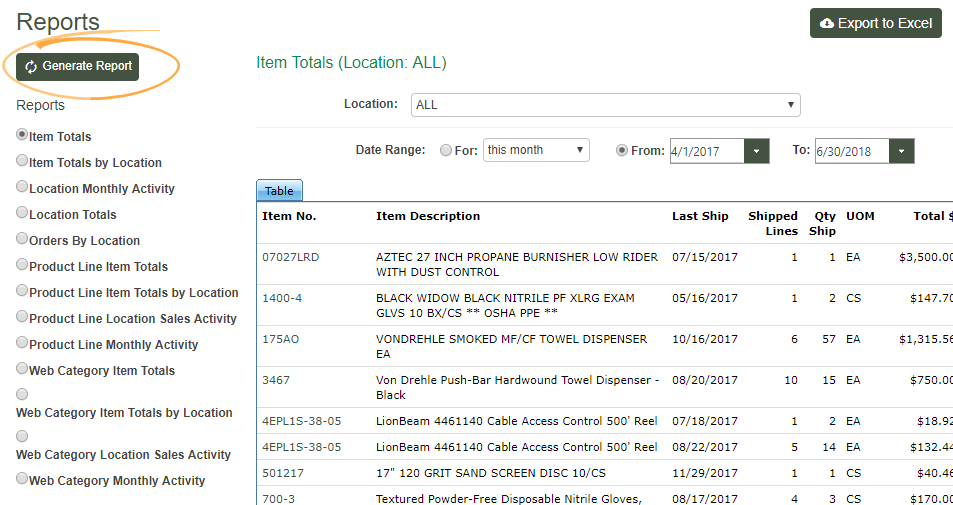
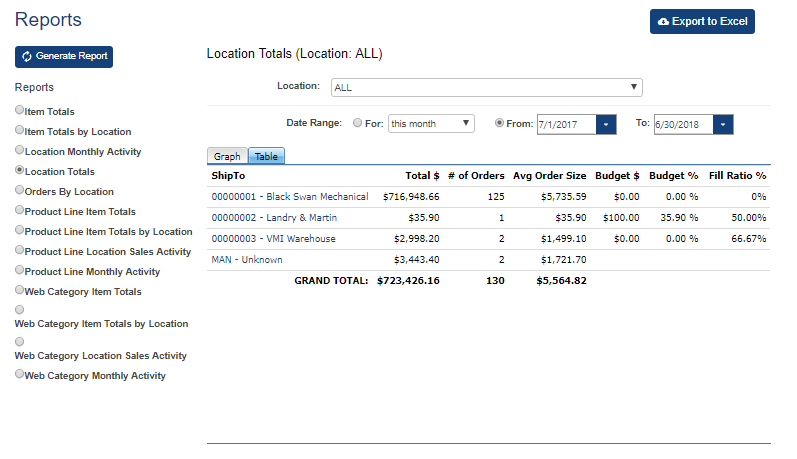
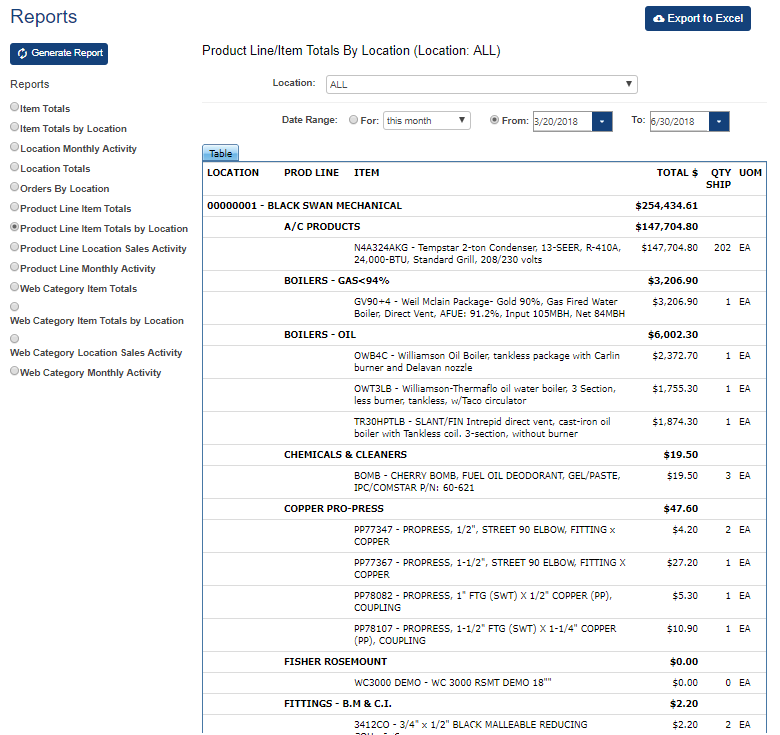
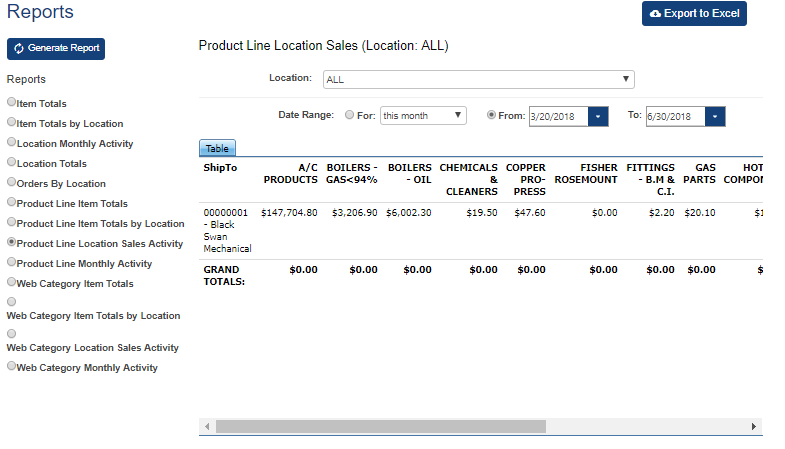
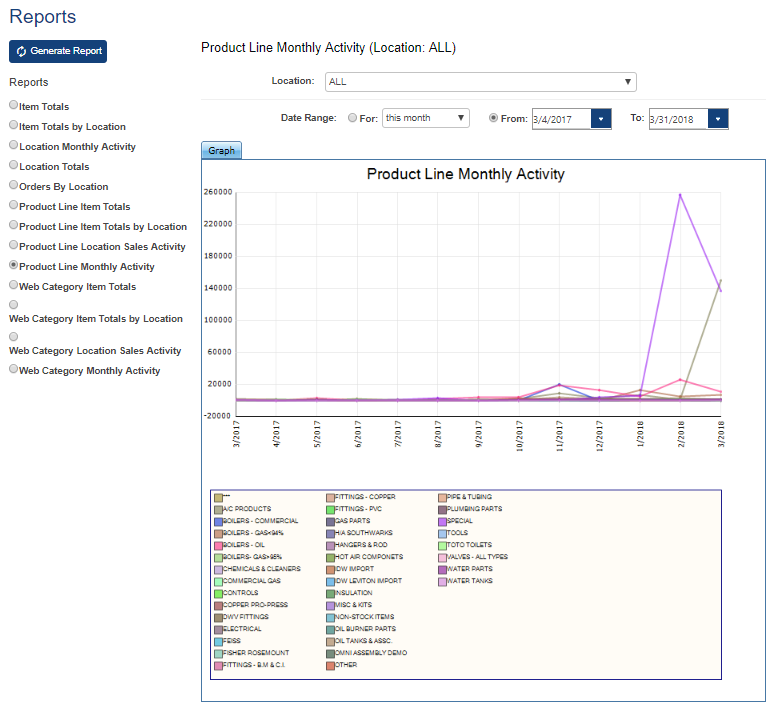
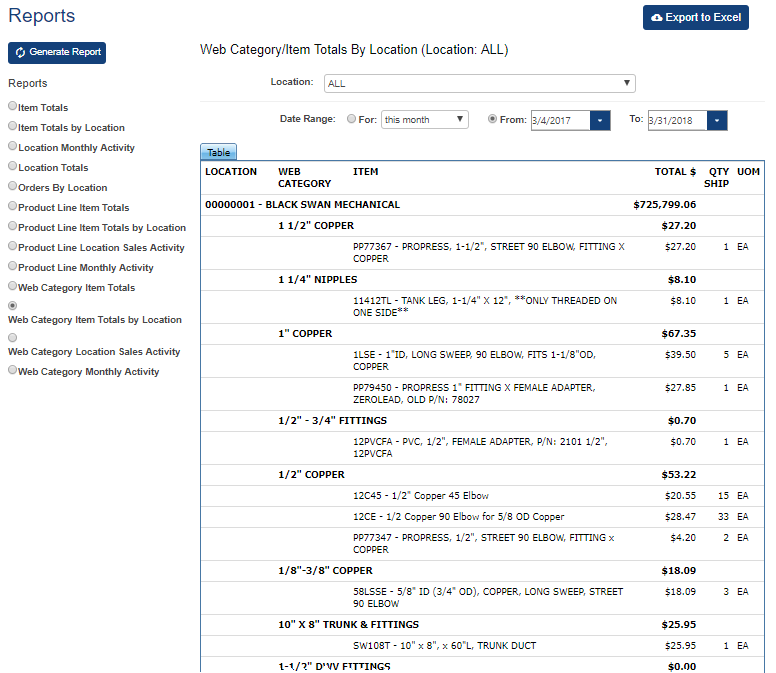
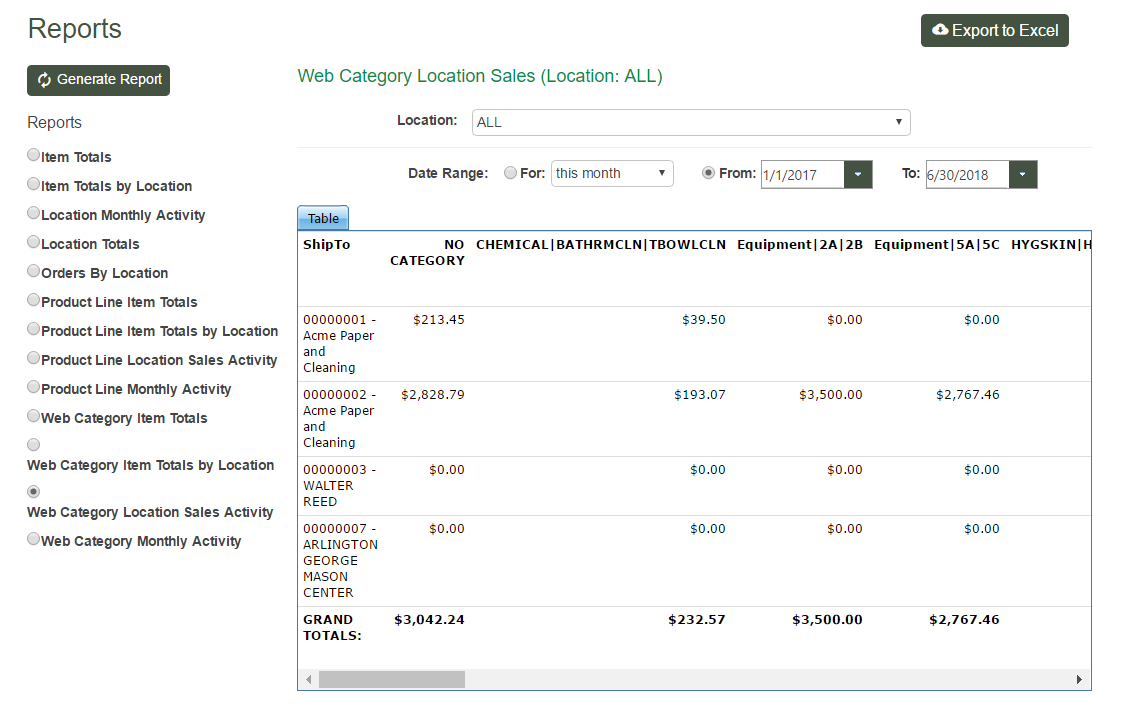
- Under Reports, click the report that you want to view. For a description of each report, see Report descriptions, below.
- Choose the ship to location on which you want to report. By default, all locations are selected. To report on a single location, select it from Location list.
- Choose the Date Range on which you want to report. For this month is the default. You can either change that monthly value, or click the From option button and then click the drop down arrow to choose the date range from the From and To calendars. You may choose dates from 1/1/2000 to 12/31/2099.
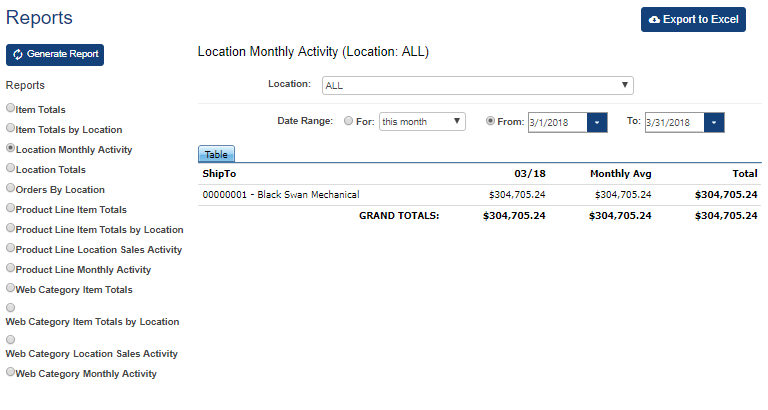
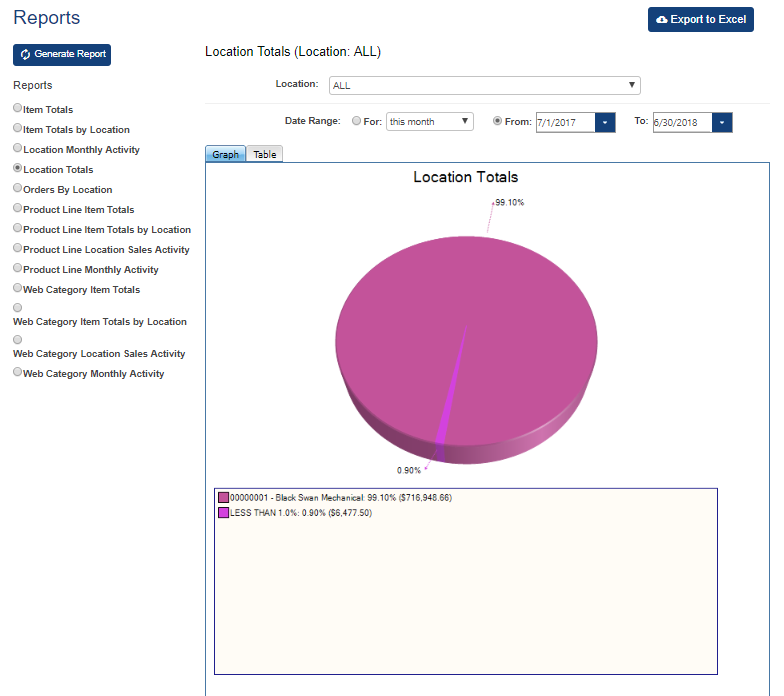
- Click Generate Report . If available, click on the Graph or Table tabs to view the data in different formats.
- For graphs, hover the mouse over any section to view details in a hover tip window.
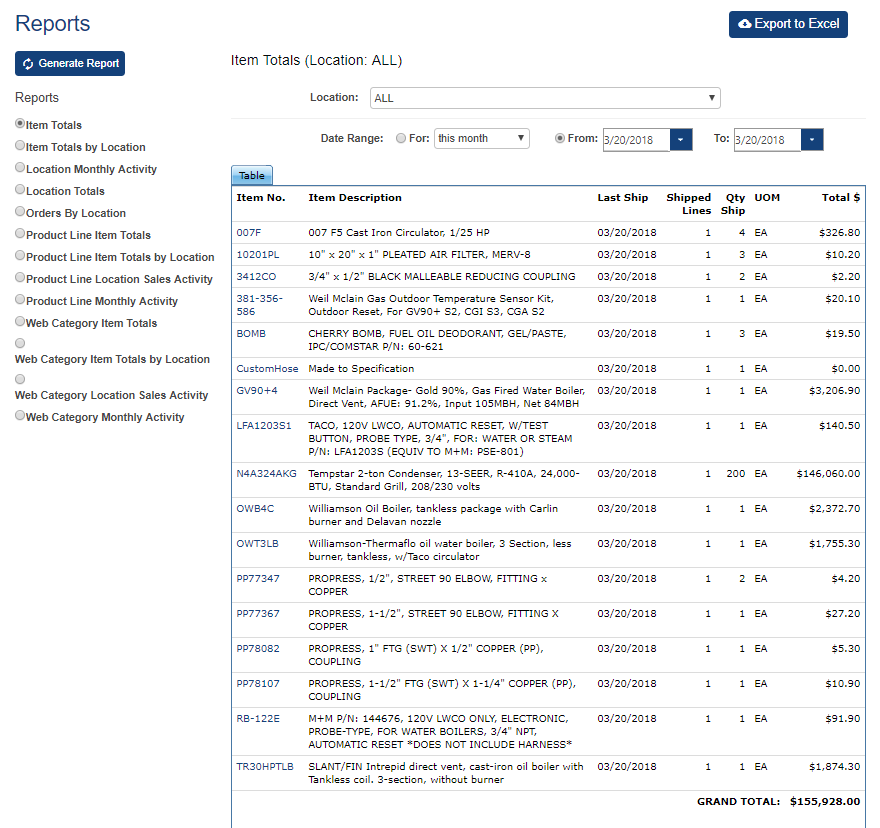
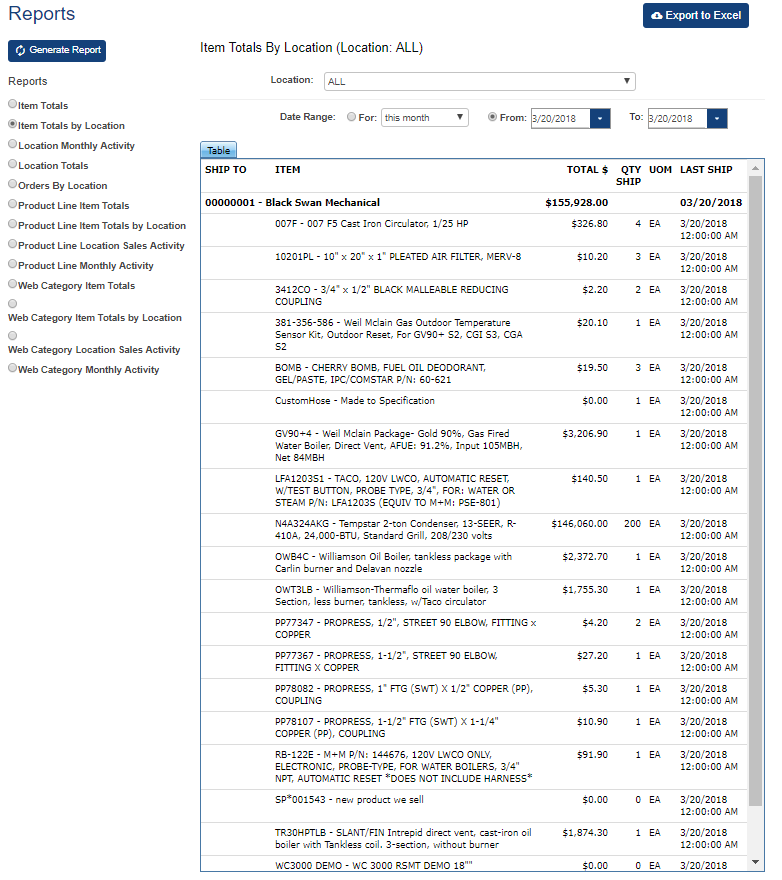
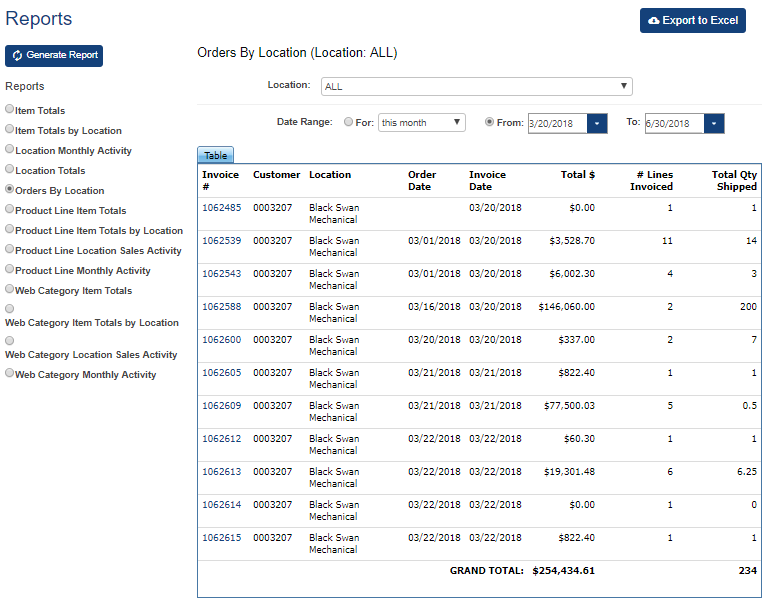
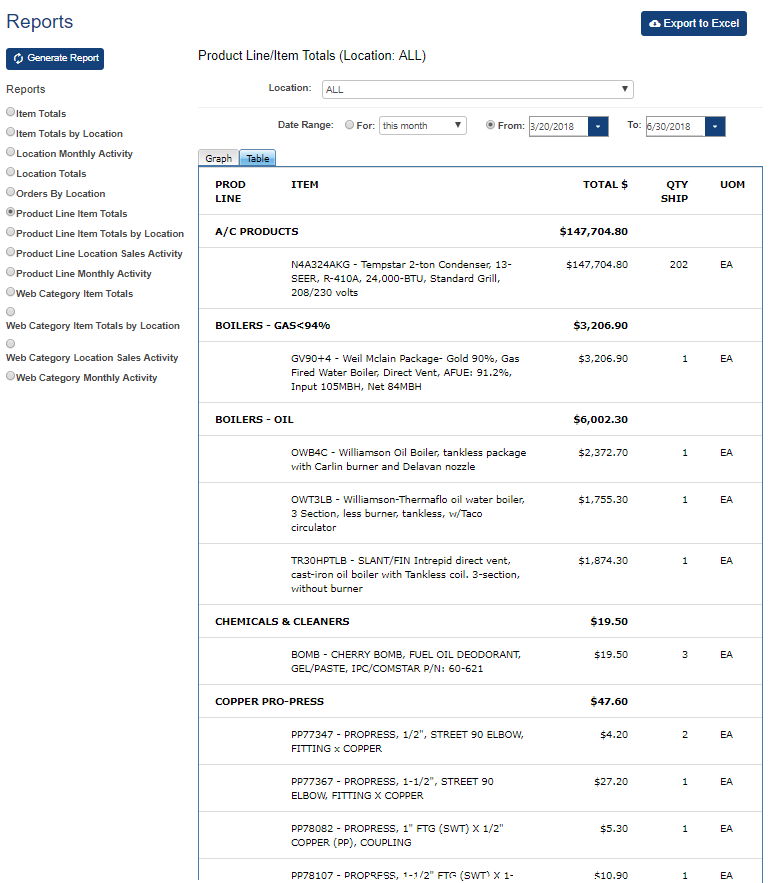
- For tables, click any available hyperlinks to drill down for further information. To return to the highest level of the report, click your browser's Back button.
- To export table data to a report for further data manipulation, click the Export to Excel button. This option is available only for tabular reports. The report is downloaded using your Browser's default method.
Note: When you open the exported file, if you see a message saying that the file is in a different format, then click Yes to open the file.


Did you find this topic helpful? Yes No
We're sorry...
Why wasn't this helpful? (check all that apply)
Want to tell us more? Please Email our documentation team and let us know what we can do to improve your experience.
This email is for help feedback only; if you require support, please visit our Customer Care Portal
Thanks for your feedback.
Great!
Thanks for taking the time to give us some feedback.
©2018 DDI System
Last update: July 05, 2018